R vs Python: Which is Easier to Learn for Beginners?
The debate between R and Python has long been a topic of interest among those diving into the world of data science. For beginners, this choice can significantly impact their learning curve, career path, and overall experience with data analysis and programming. Understanding which language to start with is crucial for building a solid foundation in data science. Selecting the right tool not only streamlines the learning process but also opens doors to various opportunities in the field.
In this article, we explore the strengths and challenges of both R and Python, ultimately helping newcomers make an informed decision about which language to master first.
Overview of R and Python
Brief Introduction to R: History and Usage
R, a programming language developed in the early 1990s by Ross Ihaka and Robert Gentleman, was specifically designed for statistical analysis and data visualization. It quickly gained traction within the academic and research communities due to its powerful capabilities in statistical modeling and its open-source nature. R has become synonymous with statistical computing, providing an extensive set of tools and packages to perform complex data analysis.
Brief Introduction to Python: History and Usage
Python, on the other hand, was created in the late 1980s by Guido van Rossum and released in 1991. Its design philosophy emphasizes simplicity and readability, making it an accessible language for programmers of all skill levels. Python has evolved into one of the most versatile programming languages, widely used in various domains, including web development, machine learning, data science, and automation. Its ease of use and broad applicability make it a favorite among both novice and professional developers.
What Makes R and Python Popular for Data Science?
Both R and Python boast robust ecosystems that cater to the growing needs of data scientists. R’s dominance in statistical analysis and Python’s broad versatility make them the go-to languages for data science professionals. While R is more specialized in statistical modeling and data visualization, Python offers a more general-purpose approach, making it ideal for machine learning and deep learning applications. Their widespread use in academia, research, and industry solidifies their standing as the top choices for data science.
The Learning Curve: R vs Python
Is R Easier to Learn Than Python?
When it comes to learning curves, R’s syntax is often considered less intuitive for beginners, especially those who do not have a programming background. While R excels at specific tasks such as statistical analysis and visualizations, its command structure and functionality can overwhelm newcomers. However, with its dedicated learning resources and strong community support, R remains accessible to those willing to invest time.
Python: A Simpler Choice for Beginners?
Python, on the other hand, is widely recognized for its simplicity and readability. Its syntax closely resembles natural language, making it easier for beginners to understand and write code. Python’s clear structure and lack of complex rules provide a less intimidating entry point for those new to programming, giving it a leg up for ease of learning.
Key Differences in Syntax and Structure
R and Python both have distinct syntactical structures that reflect their different purposes. R’s syntax is designed to handle complex mathematical operations, which can make it more difficult for beginners who are unfamiliar with coding. In contrast, Python’s syntax is clean and straightforward, prioritizing readability and simplicity over complexity.
Which Language is More Beginner-Friendly?
Python’s straightforward and user-friendly design positions it as the more accessible language, particularly for individuals with no background in programming. Its widespread use in educational resources further enhances its accessibility. R may be a bit more challenging to master initially, but its specialized tools for data analysis can offer advanced users unparalleled power.
Syntax and Code Structure
R Syntax Explained for Beginners
R’s syntax revolves around its ability to manipulate vectors, matrices, and data frames. It uses an object-oriented approach, where objects such as data frames and matrices are created and manipulated using specific functions. For beginners, the challenge lies in understanding how to organize and structure code to leverage R’s powerful statistical functions effectively.
Python Syntax Explained for Beginners
Python, on the other hand, is designed to be more readable and concise. The language uses indentation to define code blocks instead of braces or parentheses, which contributes to its clean and easy-to-understand structure. Python’s syntax also prioritizes simplicity, with straightforward commands that make it easy to read, even for someone who is just starting.
How Do R and Python Handle Data Types Differently?
R and Python both handle data types efficiently, but their approaches differ. In R, data is often organized into vectors, data frames, and matrices. Python, meanwhile, relies on more generalized data structures such as lists, tuples, dictionaries, and arrays (via the NumPy library). Python’s dynamic typing system provides more flexibility in managing data types, making it easier to switch between them.
Comparing Loops and Conditional Statements in R and Python
R and Python both support loops and conditional statements, but their implementation varies. In R, loops are written using constructs such as for, while, and repeat, while Python’s for and while loops are more versatile and often more intuitive. Python also uses indentation to define the scope of loops and conditionals, reducing syntactical complexity compared to R.
Ease of Use for Beginners
How R’s Learning Resources Cater to Newcomers
R’s learning resources have become more user-friendly over time. Online tutorials, textbooks, and forums offer guidance for beginners looking to navigate R’s complexities. Additionally, platforms like Coursera and edX provide specialized courses on R for newcomers. Despite its steeper learning curve, R’s wealth of online resources and communities support learners at every stage.
Python’s Vast Online Community and Learning Resources
Python’s extensive online community and abundant learning resources make it a top choice for beginners. From video tutorials to interactive platforms like Codecademy and freeCodeCamp, beginners have access to comprehensive materials for mastering Python. Additionally, the language’s popularity ensures that a large number of learners are readily available to share their experiences and advice.
The Role of Documentation and Support for Both Languages
Both R and Python boast thorough documentation, with extensive explanations of functions, libraries, and syntax. Python’s documentation is often regarded as particularly clear and approachable, featuring examples and detailed descriptions. R’s documentation, while thorough, can sometimes be less beginner-friendly due to the technical nature of statistical and mathematical functions.
Which Language is Better for Data Science?
R vs Python: Which One Dominates the Data Science Landscape?

While both languages play significant roles in data science, Python has become the more dominant language in recent years. Its ability to handle machine learning, artificial intelligence, and deep learning, in addition to traditional data analysis, has made it a versatile tool in the data science toolkit. R, however, maintains its stronghold in statistical analysis and visualization.
Python’s Versatility in Data Science Applications
Python excels in multiple domains of data science, including data manipulation, machine learning, and deep learning. Libraries like TensorFlow, Keras, and Scikit-learn provide powerful tools for data analysis and modeling, making Python an all-in-one solution for many data science applications.
Why R is Favored in Statistical Analysis
R is the preferred language for statisticians and researchers due to its vast array of built-in statistical functions. It is ideal for performing complex statistical analysis, including hypothesis testing, regression analysis, and time-series analysis. With packages like lme4 and caret R offers advanced statistical techniques that are difficult to replicate in Python.
When to Choose R Over Python for Specific Tasks
If your focus is on advanced statistical analysis or data visualization, R is often the better choice. Its specialized packages and tools allow for deeper insights into data, making it the preferred language for researchers in the field of statistics.
When to Choose Python Over R for Data Science Projects
For projects involving machine learning, web development, or real-time analytics, Python is the superior choice. Its versatility across multiple domains makes it a better fit for tasks beyond traditional data analysis.
Libraries and Frameworks for Beginners
Key R Libraries for Beginners: ggplot2, dplyr, tidyr
R’s libraries, such as ggplot2 for data visualization, dplyr for data manipulation, and tidyr for data cleaning, provide powerful tools for data science beginners. These libraries offer intuitive functions that allow users to perform complex tasks with relatively simple code.
Key Python Libraries for Beginners: Pandas, Matplotlib, NumPy
Python’s libraries, including Pandas for data manipulation, Matplotlib for visualization, and NumPy for numerical computations, are essential for any beginner looking to enter the world of data science. These libraries offer a range of functionalities that are easy to learn and implement in projects.
How Libraries Impact Learning in Each Language
Libraries play a crucial role in learning both R and Python. For beginners, libraries provide the tools needed to perform real-world tasks without having to build everything from scratch. While R’s libraries are particularly suited to statistical analysis and visualization, Python’s libraries offer broader versatility, particularly for machine learning.
Which Language Has Better Beginner-Friendly Libraries?
Python’s libraries are often considered more beginner-friendly due to their clear syntax and extensive documentation. However, R’s specialized libraries for statistical tasks and visualizations make it a powerful tool for data science projects that require advanced analytics.
Support for Visualization
R vs Python in Data Visualization: Pros and Cons
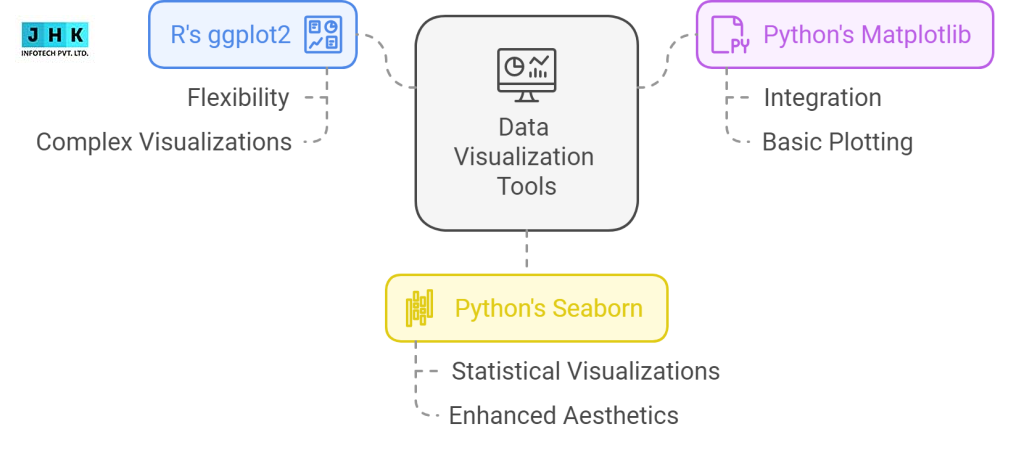
Both R and Python provide strong visualization tools, but each excels in different areas. R’s ggplot2 is renowned for its flexibility and capability in producing complex visualizations with relatively little code. Python, on the other hand, offers libraries like Matplotlib and Seaborn that integrate well with other tools and frameworks, offering a more cohesive experience for data scientists working across different domains.
R’s Strengths: ggplot2 and Shiny for Beginners
R’s ggplot2 package is widely regarded as one of the most powerful tools for data visualization. Its ability to create sophisticated plots with minimal code makes it a popular choice for beginners focused on data analysis. The Shiny package further enhances R’s capabilities, enabling users to build interactive web applications.
Python’s Strengths: Matplotlib, Seaborn, and Plotly for Visualization
Python’s Matplotlib and Seaborn provide excellent support for creating static and interactive visualizations. Additionally, Plotly offers more advanced, interactive visualizations that can be integrated into web applications. Python’s visualization libraries make it easy for beginners to create stunning visuals with a relatively small amount of code.
Learning Resources for R and Python
Best Online Courses and Tutorials for Learning R
There are several high-quality online courses and tutorials available for R learners, from beginner-level introductions to advanced statistical modeling courses. Platforms like Coursera, edX, and DataCamp offer structured courses tailored to different skill levels.
Best Online Courses and Tutorials for Learning Python
Python is known for its vast collection of beginner-friendly online courses. Websites like Codecademy, freeCodeCamp, and Udemy provide excellent tutorials that take learners through the basics to advanced concepts, ensuring a thorough understanding of Python.
Free Resources to Learn R and Python
Both R and Python offer a wealth of free resources, including online forums, video tutorials, and free courses. For R, websites like R-bloggers and Stack Overflow offer valuable insights and learning materials. Python’s documentation, along with resources like Real Python and W3Schools, provides ample material for self-learners.
The Role of Interactive Platforms Like Jupyter Notebooks and RStudio
Interactive platforms like Jupyter Notebooks for Python and RStudio for R provide environments where beginners can experiment with code in real-time. These platforms allow users to write, test, and visualize their code easily, which accelerates the learning process and enhances understanding.
Community Support and Learning Environment
Python’s Beginner Community: Forums, Blogs, and Tutorials
Python is home to one of the most expansive and dynamic programming communities in the world. Beginners can find ample support on forums like Stack Overflow, blogs, and YouTube channels dedicated to Python. This supportive ecosystem helps learners overcome challenges and stay motivated as they progress.
R’s Community Support for Beginners
R’s community, while smaller than Python’s, is incredibly dedicated. Platforms like RStudio Community and Stack Overflow provide a space for beginners to ask questions, share experiences, and troubleshoot issues. The community’s focus on statistics and data analysis fosters a collaborative learning environment.
How Active Communities Help Beginners Stay Motivated
The active support from both Python and R communities plays a critical role in keeping beginners engaged. Whether through online discussions, tutorials, or peer mentorship, both languages offer avenues for learners to connect with more experienced programmers, which in turn accelerates their learning process.
Finding Mentors and Resources Within the R and Python Communities
Mentorship is invaluable when learning programming languages. Both Python and R have thriving communities where learners can find mentors and access resources such as tutorials, webinars, and conferences. These resources help newcomers navigate challenges and gain deeper insights into the language.
Job Market and Career Opportunities for R and Python Beginners
Career Paths for Beginners Learning Python
Python’s versatility opens up numerous career paths for beginners, ranging from web development to data science and machine learning. Positions like data analyst, machine learning engineer, and software developer are just a few examples of jobs that rely heavily on Python.
Career Paths for Beginners Learning R
While R is more niche, it still offers promising career opportunities for beginners, particularly in fields like statistics, data analytics, and research. Positions such as data scientist, statistician, and research analyst are ideal for R enthusiasts looking to specialize in data-driven roles.
Which Language is in Higher Demand for Entry-Level Positions?
Python is currently in higher demand in the job market, particularly in data science, machine learning, and software development. Its versatility across various industries and sectors gives it a clear advantage over R when it comes to job opportunities.
Which Language Opens Up More Job Opportunities for Beginners?
Python’s widespread applicability in diverse fields, coupled with its dominance in data science and technology, ensures that beginners have more job opportunities. However, R remains a strong contender for specialized roles in statistics and academic research.
Learning Path: R vs Python
Suggested Learning Paths for Python Beginners

For Python beginners, starting with basic programming concepts and gradually moving to data science libraries like Pandas, Matplotlib, and NumPy is recommended. Exploring machine learning frameworks like Scikit-learn and TensorFlow is also beneficial as you progress.
Suggested Learning Paths for R Beginners
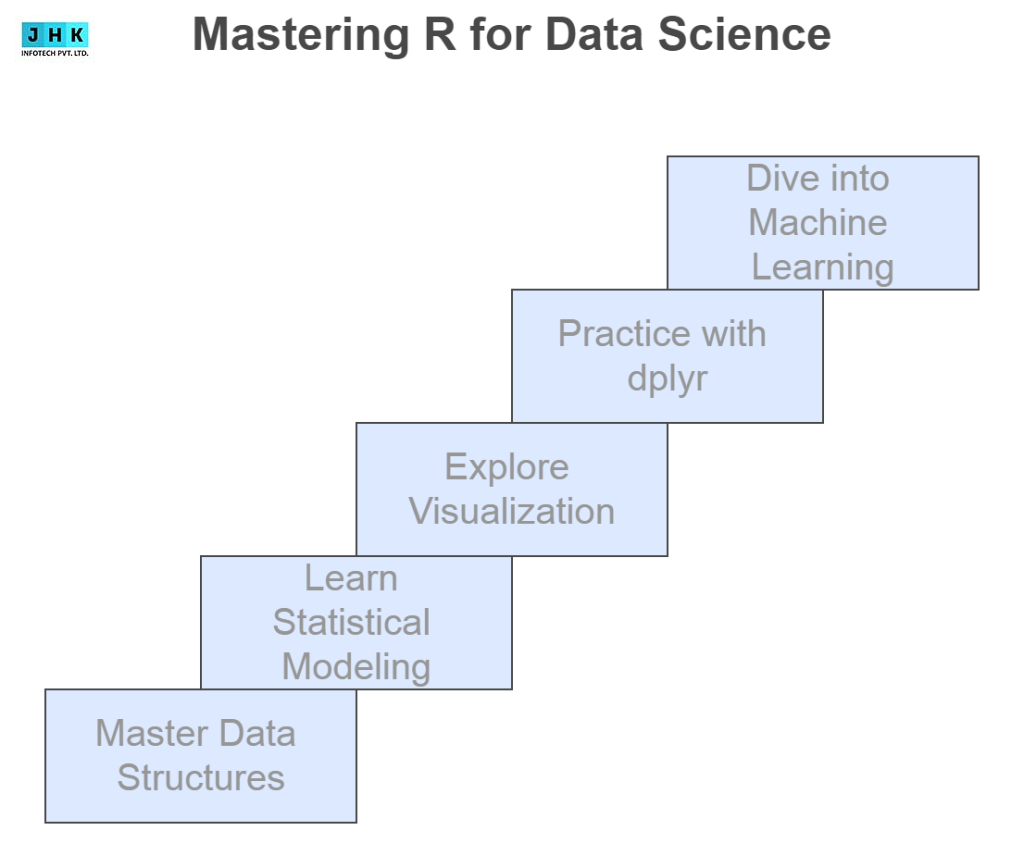
For R, it’s best to begin by mastering data structures like vectors and data frames, then move on to statistical modeling and visualization using libraries like ggplot2 and dplyr. Once comfortable, exploring machine learning packages in R can further enhance your skill set.
How Long Does It Take to Become Proficient in R or Python?
The time it takes to become proficient in R or Python varies, depending on your prior experience and the intensity of your learning. On average, beginners can expect to become proficient in 3 to 6 months with consistent study and practice.
Challenges Beginners Face with R and Python
Common Challenges Beginners Face with R
For beginners, R’s steep learning curve is one of the biggest obstacles. The language’s reliance on statistical terminology and complex functions can make it difficult to grasp at first. However, once you understand the basic principles, the power of R becomes evident.
Common Challenges Beginners Face with Python
While Python is more accessible than R, beginners may struggle with concepts like object-oriented programming, libraries, and frameworks. The sheer number of libraries can also be overwhelming for newcomers who are unsure where to begin.
Tips for Overcoming Obstacles in Learning Either Language
Staying persistent, practicing regularly, and using interactive resources are key to overcoming these challenges. Engaging with communities, seeking mentorship, and working on practical projects can also expedite the learning process and make the languages more approachable.
Which Language is More Fun for Beginners to Learn?
How Python’s Simplicity Makes Learning Fun
Python’s clean and easy-to-read syntax makes learning fun and rewarding. The sense of accomplishment that comes from solving problems with Python is often immediate, making it a popular choice for beginners who want quick results.
R’s Analytical Power and Its Appeal to Learners
While R may present a steeper learning curve, its analytical power and specialized libraries for data science make it incredibly rewarding for those who enjoy working with statistics and visualizations.
How Engaging in Real-World Projects Can Boost Motivation
Real-world projects provide the ultimate motivation for learners of both languages. By applying the skills learned through tutorials to practical, hands-on tasks, beginners can solidify their knowledge while maintaining interest in the language.
Practical Projects for Beginners
Practical Beginner Python Projects to Kickstart Your Learning
Simple projects like building a calculator, analyzing datasets, or creating web scraping scripts are excellent starting points for Python beginners. These projects introduce key concepts and give learners the confidence to tackle more complex challenges.
Practical Beginner R Projects to Get Hands-On Experience
For R beginners, projects such as analyzing sports statistics, performing sentiment analysis, or visualizing environmental data offer hands-on experience in the language’s core strengths—statistics and data visualization.
How Working on Projects Helps Solidify Learning in Both Languages
Working on projects reinforces the concepts learned in theory and provides a tangible sense of progress. It also gives beginners an opportunity to tackle real-world problems, which enhances learning and deepens understanding.
Cost of Learning R and Python
Free vs Paid Resources for R and Python
Both R and Python offer a plethora of free resources, including open-source tutorials, forums, and documentation. However, paid resources such as structured courses on platforms like Coursera and Udemy can offer a more guided and comprehensive learning experience.
Which Language Offers Better Affordability for Beginners?
Both R and Python offer affordable learning options. Given Python’s broader scope and application, it may be easier to find free or low-cost resources to learn the language. R also provides free resources, particularly through community-driven content.
Python vs R in Academic Settings
Python’s Role in Academic Learning and Research
Python’s versatility has made it an integral part of academic research across various fields, from computer science to biology. Its broad applicability ensures that students and researchers alike can leverage Python’s tools for data analysis and machine learning.
R’s Dominance in Statistical Courses and Research
R has long been the preferred language for students and researchers in fields like statistics, economics, and biostatistics. Its specialized statistical libraries make it an invaluable tool for academia.
Which Language is More Accessible for Academic Beginners?
While both languages are accessible, Python’s simplicity and readability make it easier for academic beginners to pick up quickly. R’s statistical power, however, makes it indispensable for those specializing in data-driven academic disciplines.
Final Thought
Ultimately, the language you choose depends on your specific goals. If you’re aiming for a career in data science, machine learning, or general programming, Python is likely the best option. However, if your focus is on statistics or data visualization, R may provide a more tailored experience.
Python’s ease of use and adaptability make it an ideal language for those just starting their programming journey. In contrast, R’s specialized statistical capabilities make it indispensable for advanced data analysis and research.
FAQ’s
1. What makes R more challenging to learn than Python for beginners?
R is often considered more difficult for beginners because its syntax and structure are primarily designed for statistical analysis, which can feel less intuitive to those without a data science background. Python, on the other hand, has a simpler, more readable syntax and a wide range of beginner-friendly resources. While R excels in specialized statistical tasks, its learning curve can be steeper for those starting from scratch.
2. What are good tools or libraries for beginners in R or Python?
For R, beginners can start with RStudio for a user-friendly coding environment and libraries like ggplot2 (data visualization), dplyr (data manipulation), and tidyverse (data science workflows).
For Python, popular beginner tools include Jupyter Notebook for interactive coding and libraries like pandas (data analysis), matplotlib (visualization), and scikit-learn (machine learning basics).
3. Which beginner-friendly tools and libraries are best for learning R or Python?
For beginners dedicating consistent effort (about 5–7 hours a week), Python can take 2–3 months to reach a comfortable beginner-to-intermediate level. R may require 3–4 months to achieve similar proficiency, mainly due to its specialized focus on statistics and data analysis. However, the timeline depends heavily on your prior programming experience and learning goals.
4. Between R and Python, which programming language is easier for beginners to learn?
Python is generally easier for beginners because of its clean syntax, extensive community support, and versatility in different programming fields. R is extremely powerful for statistical analysis and data visualization, but may feel more complex at the start. If you’re looking for a broad skill set, Python might be better; if you’re focused on statistics and analytics, R is worth the effort.
Recent Post
-

-

February 26, 2026
AI Trends 2026: Latest AI Innovation, Developments & Predictions
-

February 23, 2026
Hyper-Personalization in Marketing: Examples, AI & Benefits
-

February 6, 2026
Search and Type URL: What It Means, How It Works, and Why It Appears
-

January 13, 2026
Does Linking to Other Websites Help SEO? Explained in Detail